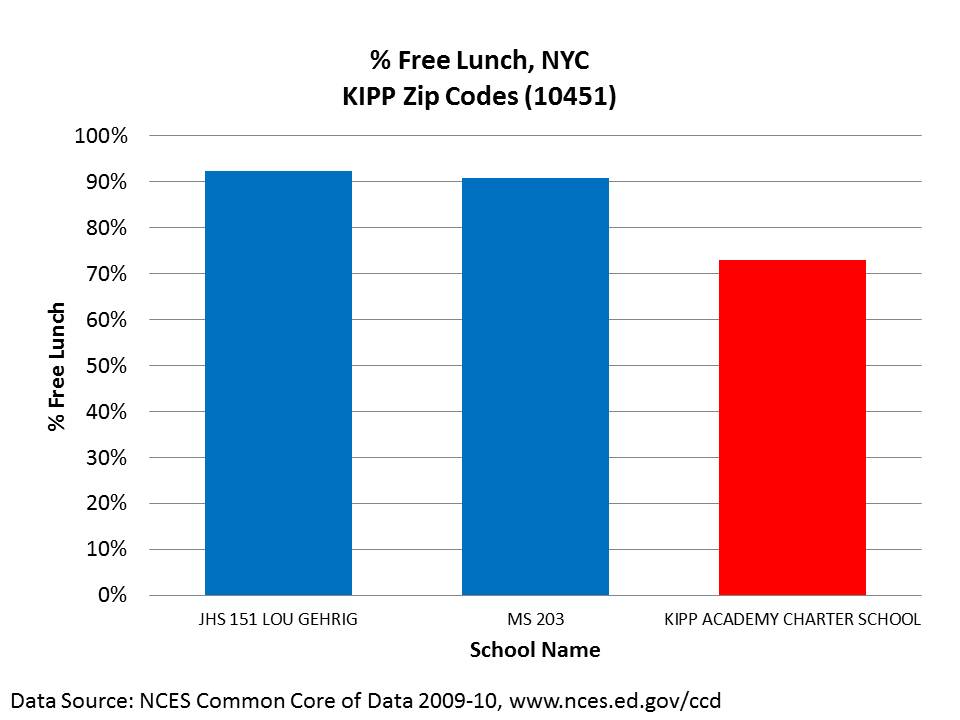
Just one graph from School Finance 101 tells most of the story, which you should go read now.
If you're not sure what the graph is showing, it is showing that the neediest kids, described by how many free and reduced lunches are served, are under-represented at KIPP schools in the zip-code in the title of the graph.
This means that when charters claim they are doing better than the other schools around them they also need to mention that the population in the KIPP school is very different than the populations of the comparison schools, making the comparison moot, or useless, or spin. You can decide which it is.